Land Expansion, Fertilizer Use, and Agricultural Greenhouse Gas Emissions in ASEAN: A Dynamic Panel ARDL Analysis 10.32526/ennrj/25/20260078
Article Sidebar
Main Article Content
Abstract
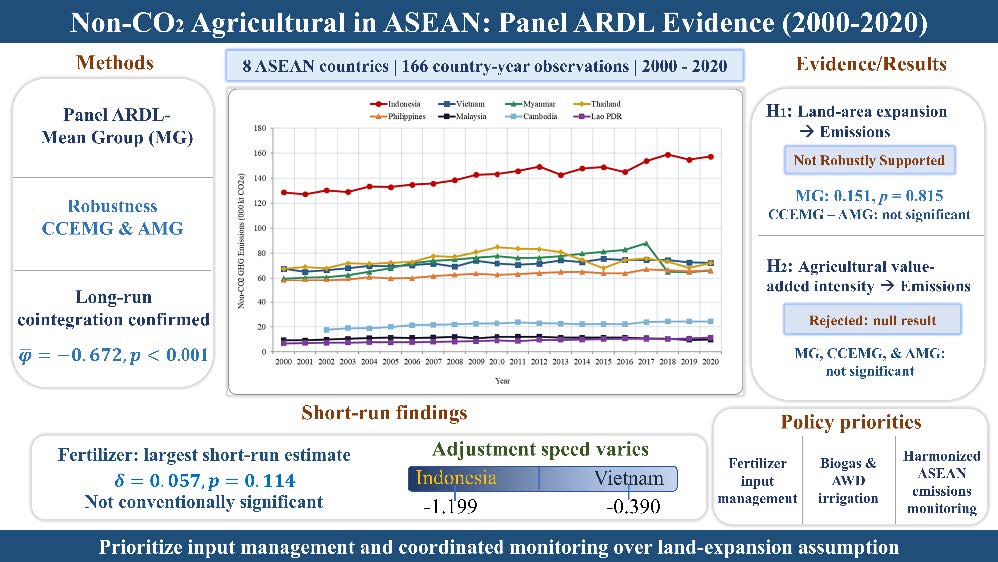
The agricultural sector of the Association of Southeast Asian Nations (ASEAN) was identified as a significant yet under-researched source of non-CO₂ greenhouse gases, nitrous oxide (N₂O), and methane (CH₄). This study applied a Panel Autoregressive Distributed Lag (Panel ARDL) Mean Group (MG) estimator on 166 country-year observations across eight ASEAN member states (2000-2020) to test two hypotheses: H₁ (land area expansion is positively associated with long-run emissions) and H₂ (agricultural value-added intensity is positively associated with emissions). A fertilizer control variable, ln(Fert), was included to correct omitted variable bias. The error correction term (φ̄ = -0.672, p<0.001) confirmed long-run cointegration. The long-run land-area elasticity was not robustly identified: the pooled MG estimate (θ_Land=0.151, p=0.815) was statistically indistinguishable from zero, and this remained the case under estimators that accounted for cross-sectional dependence (CCEMG θ_Land= -0.479, p=0.311; AMG θ_Lan= -0.552, p=0.210). Only the Fixed Effects within estimator, which did not model cross-sectional dependence, yielded a positive and marginally significant coefficient under cluster-robust inference (β_Land=0.412, p=0.092); H₁ was therefore not robustly supported. H₂ was rejected across MG, CCEMG, and AMG estimators (θ_VA/β_VA not statistically distinguishable from zero in any specification), reported here as a null result. In the short run, fertilizer use showed the largest point estimate among the differenced regressors (δ_Fert=0.057, p=0.114), though this did not reach conventional significance at the pooled MG level. Adjustment speeds varied from Indonesia (φᵢ= -1.199, fastest) to Vietnam (φᵢ= -0.393, slowest). Policy priorities include fertilizer input management, scaling biogas and Alternate Wetting and Drying (AWD) irrigation, and harmonising ASEAN emission monitoring frameworks.
Article Details

This work is licensed under a Creative Commons Attribution-NonCommercial 4.0 International License.
Published articles are under the copyright of the Environment and Natural Resources Journal effective when the article is accepted for publication thus granting Environment and Natural Resources Journal all rights for the work so that both parties may be protected from the consequences of unauthorized use. Partially or totally publication of an article elsewhere is possible only after the consent from the editors.
References
1. ASEAN Secretariat. ASEAN state of climate change report [Internet]. 2021 [cited 2026 Oct 27]. Available from: https://asean.org/book/asean-state-of-climate-change-report/.
2. ASEAN Secretariat. Study on Decarbonising the ASEAN Agriculture and Forestry Sector. Jakarta, Indonesia: ASEAN Secretariat; 2023.
3. Bui Minh T, Nguyen Ngoc T, Bui Van H. Relationship between carbon emissions, economic growth, renewable energy consumption, foreign direct investment, and urban population in Vietnam. Heliyon 2023;9(6):e17544.
4. Cameron AC, Gelbach JB, Miller DL. Bootstrap-based improvements for inference with clustered errors. Review of Economics and Statistics 2008;90(3):414-27.
5. Cole MA, Elliott RJR. Determining the trade-environment composition effect: The role of capital, labor and environmental regulations. Journal of Environmental Economics and Management 2003;46(3):363-83.
6. Eberhardt M, Teal F. Econometrics for grumblers: A new look at the literature on cross-country growth empirics. Journal of Economic Surveys 2011;25(1):109-55.
7. Food and Agriculture Organization (FAO). Emissions due to Agriculture: Global, Regional and Country Trends 2000-2018. FAOSTAT Analytical Brief No. 18. Rome: FAO; 2020.
8. Food and Agriculture Organization (FAO). FAOSTAT: fertilizers by nutrient database [Internet]. 2024 [cited 2026 Aug 18]. Available from: https://www.fao.org/faostat/en/#data/RFN.
9. Grossman GM, Krueger AB. Economic growth and the environment. Quarterly Journal of Economics 1995;110(2):353-77.
10. Haider A, Rankaduwa W, Husnain MIU, Shaheen F. Nexus between agricultural land use, economic growth and N2O emissions in Canada: Is there an Environmental Kuznets Curve? Sustainability 2022;14(14):Article No. 8806.
11. Intergovernmental Panel on Climate Change (IPCC). 2019 refinement to the 2006 IPCC guidelines for national greenhouse gas inventories [Internet]. 2019 [cited 2026 Aug 18]. Available from: https://www.ipcc-nggip.iges.or.jp/ public/2019rf/.
12. Lamb WF, Wiedmann T, Pongratz J, Andrew R, Crippa M, Olivier JGJ, et al. A review of trends and drivers of greenhouse gas emissions by sector from 1990 to 2018. Environmental Research Letters 2021;16(7):Article No. 073005.
13. Malaysia Ministry of Energy, Science, Technology, Environment and Climate Change. Malaysia Third National Communication and Second Biennial Update Report to the UNFCCC. Putrajaya, Malaysia: Ministry of Energy, Science, Technology, Environment and Climate Change; 2018.
14. Pesaran MH. General diagnostic tests for cross section dependence in panels. (Cambridge Working Papers in Economics; No. 0435) Cambridge: Faculty of Economics, University of Cambridge; 2004.
15. Pesaran MH. Estimation and inference in large heterogeneous panels with a multifactor error structure. Econometrica 2006;74(4):967-1012.
16. Pesaran MH, Shin Y, Smith RP. Pooled mean group estimation of dynamic heterogeneous panels. Journal of the American Statistical Association 1999;94(446):621-34.
17. Sobirov Y, Artikov B, Khodjaniyozov E, Marty P, Saidmamatov O. Economic growth, FDI, tourism, and agricultural productivity as drivers of environmental degradation: Testing the EKC hypothesis in ASEAN countries. Sustainability 2025;17(18):Article No. 8394.
18. Triani M, Tambunan HB, Dewi K, Ediansjah AS. Review on greenhouse gases emission in the Association of Southeast Asian Nations (ASEAN) countries. Energies 2023;16(9): Article No. 3920.
19. Vo TBT, Wassmann R, Tirol-Padre A, Cao VP, MacDonald B, Espaldon MVO, et al. Methane emission from rice cultivation in different agro-ecological zones of the Mekong River Delta: Seasonal patterns and emission factors for baseline water management. Soil Science and Plant Nutrition 2018;64(1):47-58.
20. Wooldridge JM. Econometric Analysis of Cross Section and Panel Data. 2nd ed. Cambridge, MA: MIT Press; 2010.
21. World Bank. World development indicators [Internet]. 2024 [cited 2026 Aug 18]. Available from: https://databank.worldbank.org/ source/world-development-indicators.
22. World Resources Institute (WRI). Climate Watch: UNFCCC data platform [Internet]. 2024 [cited 2026 Aug 18]. Available from: https://www.climatewatchdata.org/ghg-emissions.