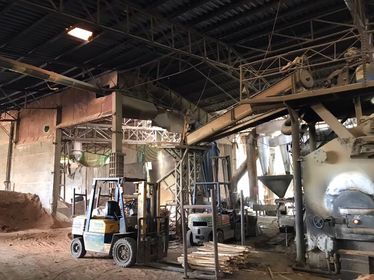
Carbon Footprint Assessment Based on Life Cycle Assessment of Biomass Power Plant
Main Article Content
Abstract
This research aims to study the carbon footprint based on the life cycle assessment of biomass power plants. Covering the acquisition of raw materials to the end of the production process in biomass power plants (cradle to grave: C2G). The study proposes constructive ways to reduce the carbon footprint of biomass power plants. Conducted research consisting of 3 phases: phase 1, the rubber plantation process; phase 2, the rubber wood processing plant; and phase 3, the biomass power plant. Assessment of carbon footprint: following the principle of life cycle assessment, the results of the carbon footprint assessment found that in Phase 1, the process of growing rubber trees throughout the life cycle calculated the carbon footprint of the sample group as average greenhouse gas emissions from fresh rubber wood and combined with the average greenhouse gas emissions from rubber wood timbers of 1.1186 kgCO2eq per day. In phase 2, rubber wood processing plants throughout the life cycle have average greenhouse gas emissions of 15,319.11 kgCO2eq per day. In phase 3, biomass power plants electricity capacity is 9.9 MW per day, and their greenhouse gas emissions are 44,753.60 kg CO2eq per day. The result found that greenhouse gas emissions from biomass power plants per 1 kWh accounted for a carbon dioxide equivalent of 4.52 kgCO2eq. Calculate the predictor factors affecting the amount of greenhouse gases in biomass power plants in raw score form as Y = 373.516 +.082 (raw material quantity), where Y is the greenhouse gas emission (kgCO2eq), using the forecast equation in standard score form. With Z =.983raw material quantity3, It was found that the quantity of raw materials had a positive correlation with the quantity of greenhouse gases at a statistical significance of .01 with a correlation coefficient of .983, which could explain the variability of the variables of the quantity of greenhouse gases with 96.70 percent accuracy.
Article Details

This work is licensed under a Creative Commons Attribution-NonCommercial-NoDerivatives 4.0 International License.
References
International Energy Agency. (2021, May 5). Global Energy Review, Assessing the effects of economic recoveries on global energy demand and CO2 emissions in 2021. https://iea.blob.core.windows.net/assets/c3086240-732b-4f6a-89d7db01be018f5e/GlobalEnergyReviewCO2Emissionsin2021.pdf/.
Office of Energy Policy and Planning. (2020). Carbon Dioxide (CO2) emissions from energy use in the first 6 months of 2020. Information and Communication Technology Center Ministry of Energy.
Electricity Generating Authority of Thailand. (2021, April 20). Electricity generation for the southern region. 2017. https://www.egat.co.th.
Integrated Provincial Executive Committee. (2021, April 25). Songkhla Province. Songkhla Provincial Development Plan 2018-2022,2019. https://dl.parliament.go.th/handle/20.500.13072/589003.
Department of Mineral Fuels. (2021, April 30). Ministry of Energy, Daily energy news. 2018. https://dmf.go.th/public/list/data/detail/id/12872/menu/593/page/3.
Chotsuwan, K.; Losuwannarat, T.; Wannanarat, S. Effectiveness of Small Biomass Power Plants in Thailand, Journal of Public and Private Management. 2020, 7(2), 5-46.
Thanarak, P.; Maneechot, P.; Wansungnern. W. (2016) Journal of Science and Technology Ubon Ratchathani University. 2016, 18(2), 22-31.
Sriwongsa, K.; Pasuwan, P.; Ravangvong, S.; Nisspa, W. The Sci of Phetchaburi Rajabhat University. 2019, 16(2), 41-48.
Thailand Greenhouse Gas Management Organization. Calculation requirements and report on the carbon footprint of the organization. 8th edition, Bangkok. 2022.
Thailand Greenhouse Gas Management Organization (Public Organization). (2021, May 30). Product Carbon Footprint. 2021. http://thaicarbonlabel.tgo.or.th/admin/uploadfiles/emission/ts_b934985782.pdf
Winning. (2021, May 30). Emission factors in kg CO2equivalent per unit. 2012. https://www.winnipeg.ca/finance/findata/matmgt/documents/2012/6822012/6822012_Appendix_HWSTP_South_End_Plant_Process_Selection_Report/Appendix%207.pdf.
Klanarong, S. Carbon footprint evaluation of electricity generation from biogas: a case study of small UASB plant. Ph.D. Thesis. Suranaree University of Technology. 2022.
Jokjit, W. Carbon Footprint for Sustainable Rubber Products.Thai rubber magazine. Bangkok. 2013, 4(1), 51-56.
Martinez-Alonso, C.; Berdasco, L. Carbon footprint of sawn timber products of Castanea sativa Mill. in the north of Spain. Journal of Cleaner Production. 2015, 102, 127-135. https://doi.org/10.1016/j.jclepro.2015.05.004
Munoz, I.; Rigarlsford, G.; Mila i Canals, L.; King, H. Accounting for greenhouse gas emissions from the degradation of chemicals in the environment. The International Journal of Life Cycle Assessment. 2012, 18(1), 252-262. https://doi.org/10.1007/s11367-012-0453-4
Suthiprapha, N.; Thongto, S. The Carbon Footprint Emission of Municipal Waste by Sources Case Study: Trakanpuetpon Municipality, Ubon Ratchathani Province. EAU Heritage Journal Science and Technology. 2020, 14(3), 161-174. https://doi.org/10.1088/1755-1315/310/5/052029
Lyu, S.; Wei, Z.; Wang, X.; Xu, L. Multiple regression analysis based on carbon emissions from aviation logistics in Henan Province. IOP Conference Series: Earth and Environmental Science. 2019, 310(5), 1-6. https://doi.org/10.1088/1755-1315/310/5/052029.
Busu, M.; Catalina Nedelcu, A. Analyzing the Renewable Energy and CO2 Emission Levels Nexus at an EU Level: A Panel Data Regression Approach. Processes. 2023, 9(1), 130. https://doi.org/10.3390/pr9010130


